Hi @NxGTR, we are only 3 weeks into the prize-phase of the evaluation phase (recall the leaderboard was reset on February 15). This means that currently it’s possible for one week with a lot of data to account for a large portion of the score. While I understand it can be worrisome to see a drop in performance, rest assured that there are many weeks left in the evaluation phase, and that the ground truth data for this evaluation will in aggregate be well distributed across grid cells and types of conditions.
Please, could you check the leaderboard and evaluation process? Since the results really looks very strange.
In my case it more seems the leaderboard shows the sum of RMSEs for 3 evaluated weeks (i.e. RMSE(week_0) + RMSE(week_1) + RMSE(week_2)) rather than just RMSE over 3 weeks.
It looks like there is some error in the leaderboard.
Could you check it, please?
I also agree with @NxGTR that information about the number of samples evaluated for each week
and the performance for each week can help to troubleshoot the issue.
1 Like
As this is a game changer for some of us (model report competition), @tglazer @emily could you please double check the evaluations and confirm whether everything is all right (e.g. the system is evaluating the right week and not one in the future)?
1 Like
Hello everyone, I’m doing an analysis of the leaderboard.
You can have the raw data here
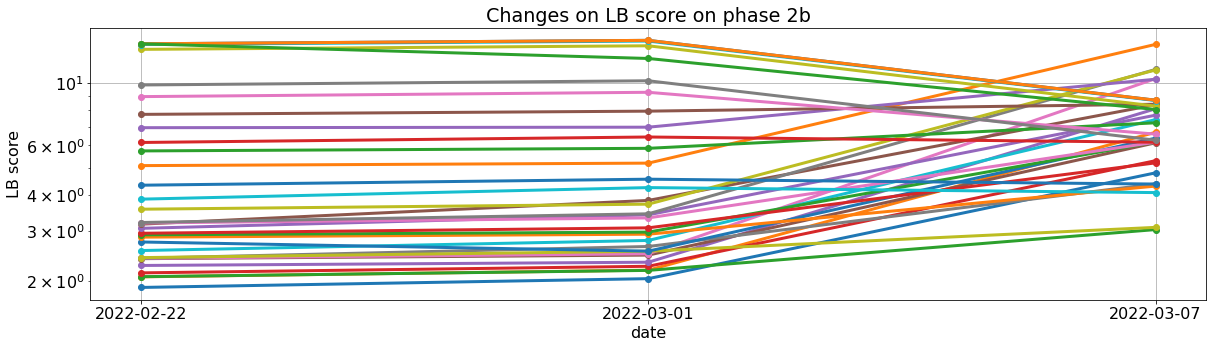
I find very suspicious that teams that were doing bad on week 1 and week 2 suddenly improve on week 3. At the same time teams that were doing it good suddenly get very bad scores. How is that possible?
Even teams that did not make a submission like ua-ck, belinda_trotta, mass_1, sgascoin, Johnny.Research… are now doing better that teams like Galeros93, dmitry_v, timothee.henry that have made submissions and had a good score on previous weeks.
The correlation between weeks is totally broken.

compare that to previous 2 weeks

I will be doing more analysis once I have time. I’m planning to estimate individual week scores to see if the hypothesis of messing up the predictions of the teams has more evidence.
2 Likes
To be able to estimate correctly the last week scores I need to know the number of measurements on each week, please @tglazer @emily kindly provide that information
Hello @tglazer, is there any chance that my last submission could be reviewed? Passing from a high R² score to a negative one, like in my case, is very strange, even if last week contained much more data. So I wonder if there was a problem with the file upload and data corruption took place. Thanks in advance.
Hi all, let me try to provide some clarity on the scoring. Please be assured that to the best of our knowledge, the scoring is working as intended.
To give you a rough sense of observations, as of this week there are around 4,000 ground truth points for 2/17 and around 200 points each for 2/24 and 3/3. Much of the 2/17 data came in this past week which accounts for the shuffling on the leaderboard. This is one way someone who didn’t submit this week could end up with an improved score.
Remember that ground truth data is scored as it becomes available, which means more data can be added for prior weeks. This is why we have you submit predictions for all grid cells for all weeks.
The RMSE is calculated over all points for which there is ground truth data. There will be lots more data coming in over the next weeks and months! We encourage you keep submitting as rankings are by no means set yet.
Finally, the weekly evaluation stage scores need not impact your modeling report. We recommend that your modeling report use the test set from the development stage period for evaluations, visualizations, and description of results.
3 Likes
Thus, some participants overfitted on “regular” SNOTEL/CODEC 200 measurements and his methods is poorly generalizes to “unregular” ASO measurements.
That is totally possible. But what is harder to understand is why all the last teams have improved.
Anyway thanks @emily for your information about the number of measurements.
For transparency I suggest to publish the updated ground truth each week. The models are frozen so nothing can be done to use that data now. And that way we could do a local evaluation and verify that the LB is correct.
Thanks!
@FBykov could you elaborate on that? Are you suggesting that the ground truth used in the training set was obtained from SNOTEL/CDEC stations and not from ASO? Otherwise, I cannot see how we could have overfitted. Thank you!
Edit: This cannot be the case, given the description of labels:
Training labels are provided for December 1 to June 30 each year from 2013 to 2019. Labels are derived from a combination of ground-based snow telemetry (ie. SNOTEL and CDEC sites) and airborne measurements (ie. ASO data).
1 Like
In the training dataset we have 90% SNOTEL/CDEC labels and 10% ASO labels. But in the evaluation dataset we have 10% SNOTEL/CDEC labels and 90% ASO labels. If the model fits the mean error then model overfitted at SNOTEL/CDEC labels and underfitted at ASO labels
How are you able to identify between SNOTEL/CDEC labels and ASO labels in the training dataset?
1 Like
@FBykov Interesting, thank you for your response. I have the same question as @oshbocker. Do you have evidence that 10% of training labels come from ASO?
2 Likes
@emily @tglazer Have you considered releasing the current ground truth so we can do a local evaluation and verify the LB? At least you could promise to do that at the end of the challenge.
Thanks
Hi @ironbar, we won’t be releasing ground truth during the competition. Thanks for the idea for releasing it after. If that seems useful to folks, we’ll definitely consider it!
2 Likes
For those with eagle eyes on the leaderboard, please note that due to the delay in the HRRR data last week, we’ve decided to exclude 2022-03-03 from the scoring in order to maintain a level playing field for everyone. Please see the details in the announcement: https://www.drivendata.org/competitions/90/competition-reclamation-snow-water-eval/announcements/.
Rescoring therefore happened twice today. We scored submissions this morning using data up through 3/10. We then re-scored all submissions this afternoon with the updated exclusion of 3/3. Wanted to surface this for transparency to help explain why you would see a different score for yourself this evening compared to this morning.
2 Likes
You can count the number of unique not nan values for each date. You will see that in most cases there are 214 measurement points each week. You can also see the data on the map. I used QGIS for this.
ASO data:

Station data (regular measurement points):

1 Like
Nice analysis @Vervan. And have you detected differences in the proportion of ASO samples between the training and the live datasets? I think different proportions between both sets would explain why some of us are having a very bad performance on the leaderboard.
@Galeros93
I think the main reason is that the new regions were added into the test data at the evaluation stage, which were not included in the training dataset. In total, about 12k new grid cells were added at the evaluation stage.
Also, I think some teams overfited on stations data (regular measurement points)
In my opinion, the score in this competition depend on the stability of the model and its spatiotemporal generalizing ability.

1 Like
Thanks, @Vervan, I also think the drop in performance is related either to the new regions or to different proportions in ASO samples between train and testing sets. But I guess this is just wishful thinking, I hope at the end of the competition we can have the ground truth labels so we can find out what happened.